AI motion graphics · Talking-head reels
AI motion graphics for talking-head reels
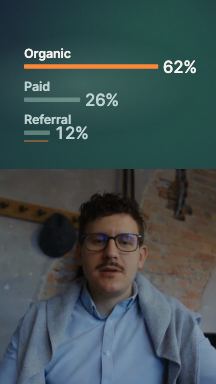
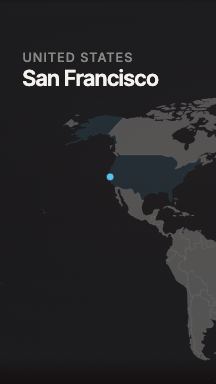
EditorOP adds motion graphics to talking-head reels based on what you say. A key number can become a stat callout, a city you name can get a map pin, and two options you compare can share a side-by-side card. Each graphic is built from your words, appears as you say them and stays up long enough to read. Edit the words, swap the design or delete any graphic on the timeline.
See plans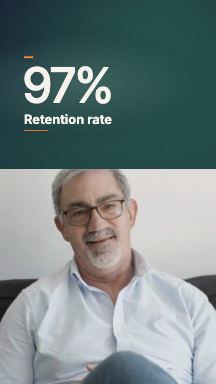
Stat callout
Bar chart
Map pin

Comparison
The idea
Graphics that come from what you say
In a talking-head reel, a motion graphic has one job: make a point easier to see. A number, a list, a place, a before and after. Graphics added for decoration pull attention away from you, and words that only repeat your captions add nothing.
So EditorOP picks graphics by trigger. Each graphic type has a moment it’s for, and it’s used only when your words call for it.
- A number with a point: “10 days”, “$40k a month”
- Stat callout
- Two to four percentages in one breath
- Bar chart
- Numbers over time: “200 users, then 3,000”
- Trend line
- A list you say item by item
- List that reveals each item as you say it
- Two things set against each other
- Comparison card
- “It’s not X, it’s Y”
- Strike and replace
- A year that anchors the story
- Year marker
- A country or city where the story happens, or a move between two
- Map with a pin or a route
- A person or company the viewer needs to know
- Name card (lower third)
- Someone’s exact words
- Quote card
How it works
How EditorOP places motion graphics
Set the intensity
Light adds captions and no extra graphics. Balanced adds a few well-placed graphics. Bold adds more graphics and cutaways.
The AI reads your transcript
It marks the moments that match a graphic type and fills each one with your own words and numbers.
Code places them
Each graphic is timed to the word it illustrates, kept at least 8 seconds from the next and held long enough to read. A graphic missing its words is dropped, not guessed.
Laid out around you
Placement uses where your face sits in the frame, and one colour theme runs through the whole reel.
You review them
Every graphic is its own piece on the timeline, ready to keep, edit or delete before you export.
On the timeline
What you can change
Words and numbers
Edit what any graphic says, from a name to a percentage.
Design
Stats, lists, name cards, comparisons and key lines come in several designs. One tap swaps the design; your words and timing stay.
Timing
Move a graphic, or trim how long it stays up.
Behind you
Where the shot allows, tuck a graphic behind a cut-out of you.
Add or remove
Add any graphic from Elements, then Graphics, or delete one the AI placed. Graphics you add are never moved or removed by the AI.
The library
What’s in the graphics library
In the editor, Elements, then Graphics, holds the whole library, grouped by what each graphic is for. Add any of them by hand, wherever you want one.
Stage
Graphics on the stage above you
Flow · Number · Checklist · Ranking · Compare · Title
Story moments
Compare, choose, show a trend
Comparison · Choices · Trend
Numbers & Stats
Callouts, bars, milestones
Callout · Bars · Year
Maps & Globes
Geo: pins, routes, regions
Globe Pin · Globe Country · Globe Route
Cards & Lists
Quotes, posts, name cards
Quote · Tweet · Lower Third · End Card
Emphasis
The payoff line, a tag by your head
Key Line · Side Tag
Photos & Sources
Photos, articles, cutouts
Photo Scene · Article Highlight · Cutout
Who it’s for
Who it’s for, and when another tool fits better
A good fit when
- You make talking-head reels with numbers, lists, places or comparisons in them.
- You want graphics that land on the right word without keyframing them yourself.
- You want the whole edit done, not only graphics: see the AI reel editor.
Another tool fits better when
- You need custom animation, logo reveals or a fully animated explainer. A motion design app gives you frame-by-frame control; EditorOP’s graphics are built for talking-head reels.
- You want a whole video generated from a script, with no footage. A text-to-video tool fits better; our guide to AI video editors covers a few.
- You want effects and auto captions on clips you edit yourself. A hands-on editor such as CapCut suits that.
- You need graphics on a long or landscape video. EditorOP makes vertical reels up to 90 seconds.
FAQ
Questions
What are AI motion graphics?
Animated text and visuals, such as stat callouts, charts, maps and name cards, that software places for you instead of a motion designer. In EditorOP, the AI reads your transcript, matches moments to graphic types and fills each graphic with your own words. Code then times and spaces them.
Which motion graphics can EditorOP add?
Stat callouts, bar charts, trend lines, lists, comparison cards, strike-and-replace corrections, year markers, maps with pins or routes, name cards and quote cards, among others. Each is used only when what you say calls for it. The full library is in the editor under Elements, then Graphics.
How many graphics will my reel get?
It depends on the intensity and on what you say. Light adds no extra graphics, Balanced adds a few well-placed ones and Bold adds more. The graphics the AI adds stay at least 8 seconds apart, and a reel with no numbers, lists or places may get very few.
Can I edit the graphics?
Yes. Change the words and numbers, swap the design of a stat, list, name card, comparison or key line in one tap, move or retime it, or delete it. You can also add any graphic from the library yourself.
Do I need design or animation skills?
No. The graphics come from a designed library, and EditorOP picks, fills and times them. You check the result and change what you want before you export.
Also in EditorOP
The rest of the edit
- AI reel editorTurn raw talking-head takes into a finished Reel, Short or TikTok: EditorOP keeps the best takes, cuts pauses, adds captions and B-roll, and you edit the rest.Read more
- AI B-roll generatorEditorOP reads what you say and places matching B-roll in your talking-head video: your own clips first, then stock footage. Swap, reframe or remove any shot.Read more
Monthly plans
Say the number. See the graphic.
Pick a monthly plan, upload a talking-head take, and see which graphics your words call for.